CUSTOM SOFTWARE
Software built around how you work
When the off-the-shelf tool almost fits, the gap gets paid for in manual work every single day. Custom software closes that gap instead of forcing the process to bend around a product.
What you get
Dashboards and analysis
Your numbers in one place, in the shape your business reads them – not the shape the tool vendor chose.
Connectors for AI models
One endpoint through which ChatGPT, Claude or any other model queries your numbers directly – read-only, aggregated, with a quota. Exactly that already runs in the Restaurant Dashboard.
Interfaces between systems
APIs and imports so data moves by itself instead of through copy and paste.
Web apps and customer portals
Anything that needs a login and data: booking, customer area, administration. We write the scope down as a fixed list, then you get an estimate, then a hosting recommendation with running costs and a handover with documentation.
Internal tools
The screen your team needs daily, without the twenty features nobody uses.
An honest answer first
If an existing product solves it, we say so. Building something you do not need is bad business for both sides.
One example, in production
The Restaurant Dashboard is our own product: analytics across several locations, a side-by-side comparison and an AI analyst that turns the numbers into sentences. The screenshots show two demo locations.
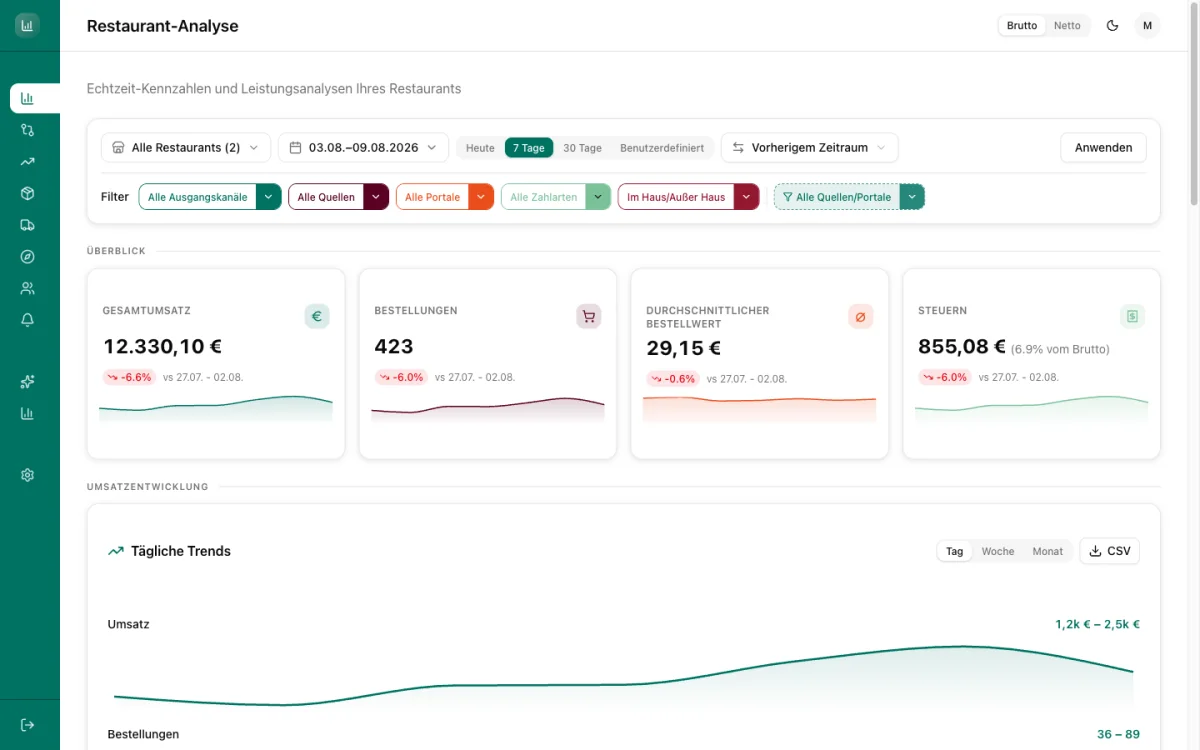
ANALYTICS
Key figures against the previous period, revenue over time, busy hours by weekday and hour.
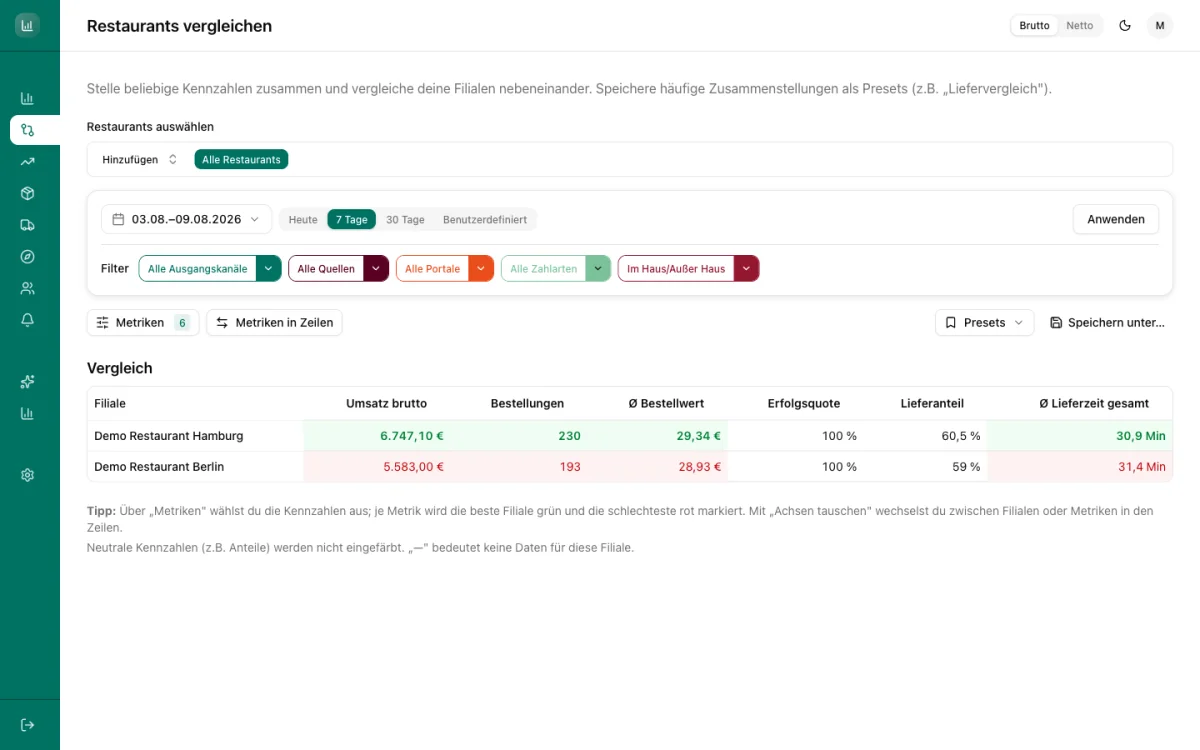
LOCATION COMPARISON
Any metrics side by side, best and weakest location highlighted per row.
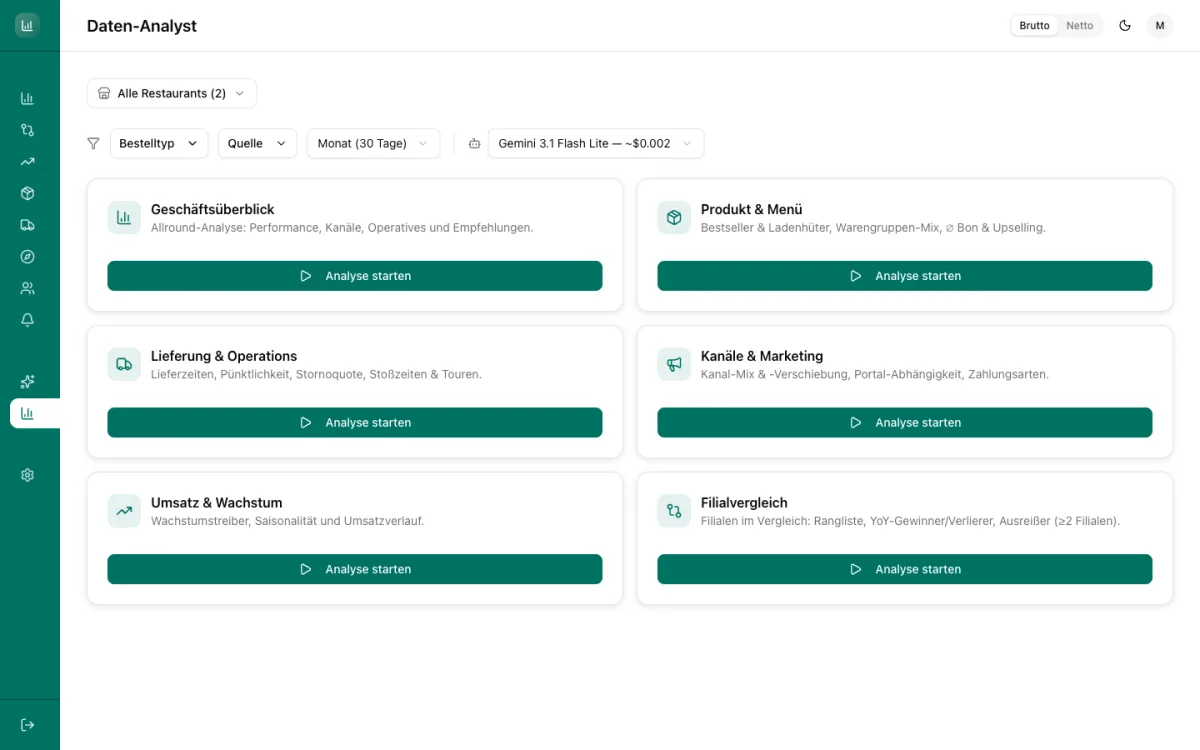
AI ANALYST
Prepared analyses run by a language model on your own data – with the cost per run in plain sight.
What else is in there
- Historical trends
- Time-series analysis aggregated by weekday, week and month – patterns instead of comparing single days.
- Product analysis
- Best-selling products, product groups and toppings. Shows the slow movers as clearly as the bestsellers.
- Customer analysis
- New versus returning customers, cohorts, RFM segments and customer value – aggregated, with no personal data.
- Explorer
- Free-form ad-hoc analysis: combine measures and dimensions yourself, without SQL and without asking IT.
- Alerting
- Anomaly detection: every day per location against its own weekday baseline, largest deviations first.
- Revenue forecast
- Seven-day net revenue forecast from historical patterns and weather data.
- Deliveries & portals
- Delivery times from kitchen to handover, delivery portals against web shop and till, cancellation rates per channel.
How it works
- 01
Understand
We look at the actual process, including the spreadsheet everyone pretends is temporary.
- 02
Smallest useful version
The first release does the one thing that hurts most. It ships early and gets used.
- 03
Grow with it
Extensions come from real use, not from a feature list written before anyone touched it.
What it costs
Hourly from €80 with an agreed scope. Bigger projects get split into stages you can stop after – you are never buying the whole thing before you have seen the first part work.
Common questions
How long does it take? +
A useful first version usually takes weeks, not months, because it does one thing rather than everything.
What happens to the code? +
It is yours, in your repository, documented. You can hand it to any other developer.
Can you work with our existing system? +
If it has an interface or a database we can read, yes. If it has neither, we say that plainly before starting.
Other things we do
WEBSITE SUBSCRIPTION
Website for small businesses as a subscription: site, upkeep and SEO for €99 a month
WEB DEVELOPMENT
Have a website built – fast, findable, no page builder
SEARCH OPTIMIZATION
SEO for small businesses: audit, fixes and local visibility
AUTOMATION
Stop doing the same work by hand
ADD-ON · MAINTENANCE
Ongoing maintenance and support